WildFish respond to United Utilities questioning of SmartRivers report
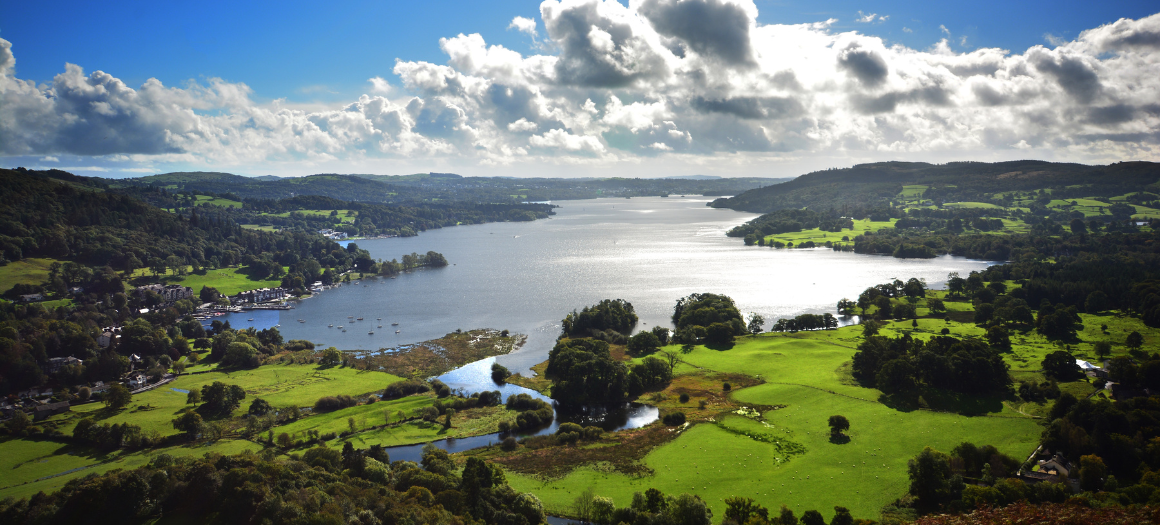
In February you may have seen our SmartRivers report produced in collaboration with our partners at Save Windermere. This data summary marks the beginning of a long-term monitoring project surveying freshwater invertebrate populations in the Windermere catchment to monitor water quality.
While there are undoubtably a lot of factors impacting the ecological health of freshwater habitats, a key concern that we share with Save Windermere are the direct impacts the water industry is known to be having through both legal and illegal means. As such our Windermere hub monitoring sites were focussed upstream and downstream of United Utilities (UU) assets in the catchment.
If you saw the piece on BBC NorthWest Today or BBC Cumbria you may have seen that UU said they would be writing to us to question the ‘selective use of data’. We have since heard from UU and as we believe it is in the public interest, we thought we would share the outlines from our exchange.
Why just the water company?
One concern was the lack of acknowledgement in our report of any other potential inputs affecting freshwater invertebrate populations. Freshwater conservation is an incredibly complex business, and we acknowledge there are a diverse range of factors contributing to the current crisis facing freshwater habitats.
The SmartRivers programme uses well established methodologies (see below) to enable passionate local groups to monitor water quality on their stretches of river through the benthic invertebrate community. This allows us to monitor anthropogenic inputs on a local scale, highlighting their impacts on freshwater habitats. This data can be used to fill the monitoring gap left by a chronically underfunded Environment Agency (EA). Our study is not meant to be a comprehensive narrative of catchment pressures, nor does it claim to be. It is simply the beginning of a citizen science invertebrate monitoring dataset that clearly suggests, due to our site choices specifically designed to monitor the effect of UU infrastructure, that these assets are having a negative impact on the ecological health of these waters. Not assessing all possible variables does not detract from assessing if a point source of pollution (e.g. a sewage treatment works – STWs) is having an impact on surrounding habitats.
Climate change, for example, was highlighted as being omitted from our report, with UU asking if we concluded that climate was having no impact on invertebrates. We are of course aware of the existential threat of climate change and the huge impact it is having on both human society and the natural world. We have in fact written a blog discussing climate change and freshwater invertebrates that you can read here. To redress or reduce the impacts of human society with regards to climate change is a multi-national, multi-generational effort that we support but are unfortunately unable to contribute to using citizen science invertebrate surveys. We can however monitor the benthic invertebrate community and highlight how improvements to water company infrastructure could improve the health of freshwater habitats at a local scale. By reducing the impact of anthropogenic pressures on the health of freshwater habitats we hope to improve their resilience to changes in climate.
One consideration tied to these atmospheric variables is water temperature. While this data is available online, we have historically not recorded this during sampling. The possibility of changing this had already been discussed internally. However, it is worth noting that on the spatial scale of sampling an individual river temperature is likely to be very similar. Therefore, other factors are likely to account for the differences between sites, and if not, factors such as water temperature are inherent to the demarcated study discharge i.e., water temperature from sewage system. We are and will always be keen to improve the quality and resolution of the data collected in the SmartRivers programme.
The range of metrics by which we monitor ecological health
Another theme of concern was the fact that we used a range of different metrics and highlighted a variety of differing impacts on the ecology of the different rivers. Well, the simple answer to this is that we calculate a range of water quality metrics from the invertebrate community to gain greater insight into the varied pressures our rivers are facing (e.g., chemical pollution or levels of fine sedimentation).
We understand the importance of building a longer-term dataset for assessing environmental health. The SmartRivers Windermere hub is in its infancy. However, the benchmark data has been collected by a professional entomologist who will continue to sample these sites this year. This will enable us to monitor consistencies and changes in each river’s pollution fingerprint. Our short summary report is exactly that – a summary of the variety of key pressures indicated by the invertebrate community centred around various UU assets in this first year of data collection.
An additional query was regarding us not using the British Monitoring Working Party (BMWP) score as a more ‘standard’ assessment of the invertebrate community. BMWP is a presence/absence taxonomic family-level assessment of the invertebrate community where each family has a score (1-10) based on pollution sensitivity. We argue that is a coarse assessment of biodiversity compared to identifying the actual species that are present in a habitat. For example, if we were doing a survey of big cats in an African savannah, a survey where you get a score for the presence/absence of the Family Felidae will not generate as detailed a picture of the ecology of the system as a survey that distinguishes between species such as lions, cheetahs, and caracal. BMWP also takes no consideration of the actual numbers of animal in a habitat, a factor we think is key to understanding changes in biodiversity. This is one reason BMWP was superseded by the WHPT family-level scoring system in 2014, as this metric does make some assessment of abundance.
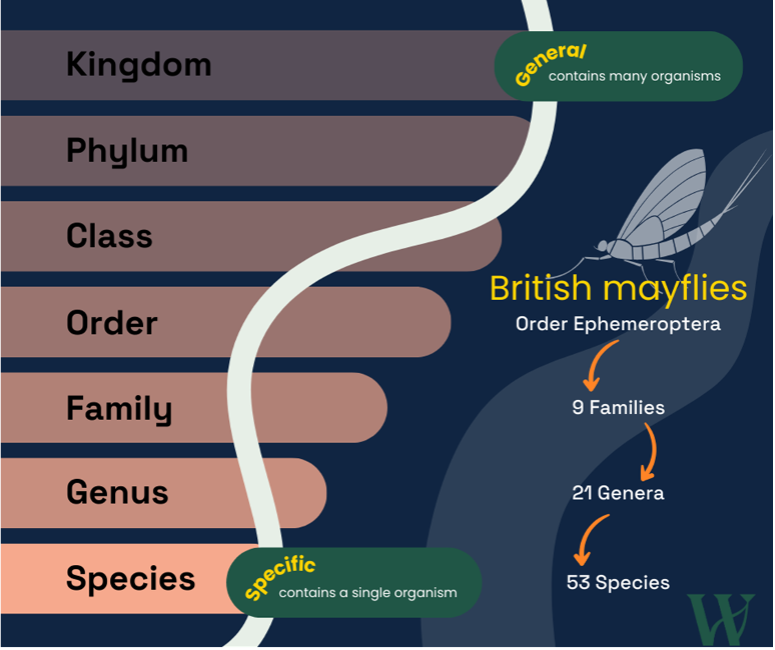
Fig 1: Using British mayflies as an example, monitoring or using scores based on family-level data risks missing important ecological detail at finer taxonomic resolution.
We still argue that family-level assessments are too broad a brush by which to assess biodiversity (read more here). The SmartRivers citizen science programme identifies invertebrates to as fine a taxonomic resolution as possible (to species when we can). By doing this we are able to calculate a greater range of metrics based on more detailed ecological data. Some of our mixed-level metrics such as PSI (sedimentation pressure) and LIFE (flow stress) are also used by the EA. Some metrics, such as SPEAR (chemical pressure) are widely used in mainland Europe and should perhaps be given more attention in the UK given the threat of chemical pollution in our rivers (remember that no rivers in England have ‘good’ chemical status). We do also calculate WHPT scores and other metrics from our data. While we highlighted specific pressures across the Windermere catchment, the entire breakdown of pressures was not included in the summary document. We will add this in an appendix to the report.
Another concern was our plotting of phosphorus pollution (TRPI) on Cunsey Beck. UU asked why we had excluded upstream data on the graph (see below). This was in fact because the scores had come back unimpacted (i.e. ‘0’) and so no bars were present. We have now updated our graphs to make this point clearer, the higher phosphate readings were seen below UU infrastructure and not above.
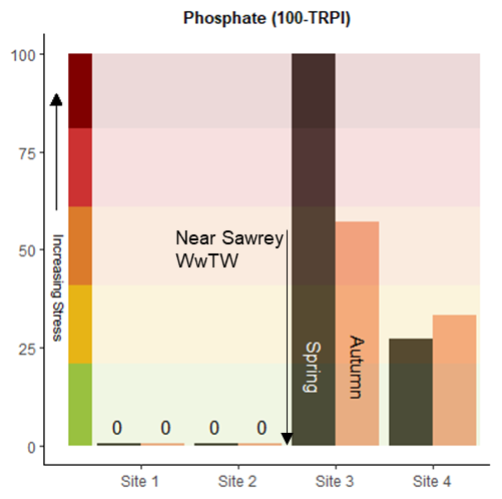
Fig. 2: The updated graph for phosphate pressure on Cunsey Beck in 2023.
UU also asked us why we highlighted the appalling difference between the invertebrate communities up and downstream of Far Sawrey Wastewater Treatment Works in autumn but didn’t discuss the negligible difference in spring. As can be seen in the figure in the report (below) we plot the data for both seasons. We chose to highlight the autumn data as it was the most shockingly impacted invertebrate community across the whole year of surveying in terms of biodiversity. If anything, this is brought into starker contrast by the negligible difference in the number of species between sites in spring (when greater flow can dilute pollution), although we still note an apparent decline in invertebrate abundance downstream of the works across seasons.
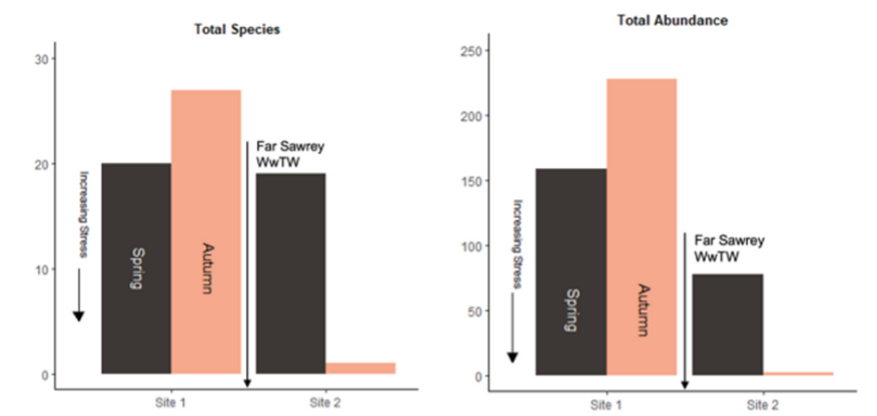
Fig 3: The invertebrate species richness and abundance levels on Wilfin Beck in 2023.
The scientific credibility of our methodologies
UU had several queries as regards to the scientific validity of the methods we use to collect invertebrates and the metrics we use to assess the communities.
WildFish is an evidence led charity.
Our sampling methodology, a three-minute kick sample and one-minute hand search, is the approach used by the EA in full invertebrate surveys and widely across the academic literature. We recognise the challenge of species-level identification and provide our hubs with invertebrate photographic resources specific to the rivers that our volunteers monitor. Also, SmartRivers includes quality control processes with regards to sampling and invertebrate identification to help our volunteers collect the highest quality data. Although, it is worth highlighting that ALL the Windermere data came from surveys collected and identified by a professional ecologist with 40 years of experience in the field. In addition to this, the water quality metrics we use are all peer-reviewed, developed in the industry by other parties. These methods are not something WildFish have ‘made-up’, we have merely collated a variety of water quality metrics in one place to help those passionate about improving their rivers collect vital monitoring data.
Site specific queries
Finally, there is one site-specific query that we needed to address. In 2022, when we initially sampled Wilfin Beck we did include two downstream sampling sites which did show a continued impact further downstream. However, considering resources and logistics we focussed on just the two sites for ongoing routine monitoring.
Additionally, UU have told us we are wrong when we say that an emergency overflow at Esthwaite is not monitored and so there is no way of knowing how often raw sewage is discharged. We have told UU that we are happy to correct this if they provide us the volume, telemetry, concentration, and spill hours for Esthwaite lodge pumping station.
We would like to point out to everyone that ALL SmartRivers data is open-access. To get access to the database please just email: smartrivers@wildfish.org


